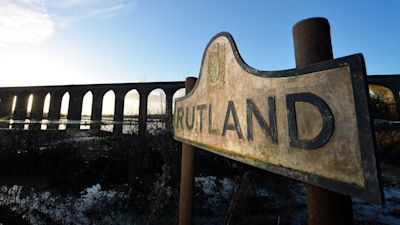
Rutland has highest infection rate in the country after Covid outbreak at prison

The number of positive tests for coronavirus in Rutland have trebled in a week taking the county to the highest infection rate in England.
The number of cases in the week to 4 February in Rutland was 199, which was up from 65 cases the week before. It means the infection rate is 498 cases per 100,000 people.
The big increase is being put down to a Covid-19 outbreak at a prison near Oakham.
Rutland is England's smallest traditional county with a population of just 40,000 people so relatively small number of people testing positive for the virus can substantially impact the overall infection rate.
The infection rate across the Anglia region as a whole has fallen to 213 cases per 100,000 in the week to 4 February. It was 297 cases per 100,000 the previous week.
The regional infection rate is still slightly higher than England as a whole where 212 cases per 100,000 were recorded during the same period.
The weekly number of cases has fallen by more than 6,000 in the latest figure - a drop of 28%.
Below is the latest update of the rolling seven-day rate of new cases of Covid-19 for every local authority area in the Anglia region.
The figures, for the seven days to Thursday 4 February, are based on tests carried out in laboratories and in the wider community. The rate is expressed as the number of new cases per 100,000 people.
The list is based on Public Health England data published on Monday 8 February on the Government’s coronavirus dashboard. Data for the most recent four days (5-8 February) has been excluded as it is incomplete and does not reflect the true number of cases.
Coronavirus cases per 100,000 people in each local authority area of the Anglia region in the week to Monday 1 February (with the previous week in brackets)
Rutland - 498.4 (162.8) up 206% compared with previous week
Corby - 441.7 (501.3) - down 12%
Peterborough - 320.9 (464.8) - down 31%
Kettering - 319.3 (332.1) - down 4%
Luton - 317.8 (500.3) - down 36%
Bedford - 316.8 (422.4) - down 25%
Northampton - 307.2 (413.6) - down 26%
King's Lynn and West Norfolk - 295.3 (307.8) - down 4%
Stevenage - 294.8 (377.9) - down 22%
Fenland - 285.7 (311.2) - down 8%
Norwich - 278.1 (347.2) - down 20%
Tendring - 273.6 (392.3) - down 30%
Watford - 273.4 (360.3) - down 24%
Welwyn Hatfield - 264.1 (411.2) - down 36%
Wellingborough - 261.0 (392.7) - down 34%
Gt Yarmouth - 257.7 (352.3) - down 27%
Hertsmere - 257.3 (369.8) - down 30%
Broxbourne - 234.4 (351.6) - down 33%
Harlow - 234.3 (373.3) - down 37%
Southend - 220.1 (282.3) - down 22%
Colchester - 215.7 (326.1) - down 34%
Milton Keynes - 215.6 (329.2) - down 34%
Braintree - 211.7 (312.6) - down 32%
Castle Point - 209.1 (292.1) - down 28%
Breckland - 208.6 (346.5) - down 40%
East Northamptonshire - 208.4 (252.8) - down 18%
Basildon - 207.3 (296.5) - down 30%
Thurrock - 201.9 (329.8) - down 39%
Central Bedfordshire - 201.6 (249.1) - down 19%
Broadland - 195.0 (289.0) - down 33%
North Hertfordshire - 192.4 (262.0) - down 27%
Dacorum - 189.3 (270.7) - down 30%
Huntingdonshire - 187.1 (235.4) - down 21%
Ipswich - 184.8 (319.2) - down 42%
Chelmsford - 179.9 (271.9) - down 34%
South Cambridgeshire - 177.9 (180.4) - down 1%
Rochford - 169.4 (262.1) - down 35%
St Albans - 166.4 (217.6) - down 24%
East Cambridgeshire - 159.2 (185.9) - down 14%
Maldon - 158.6 (240.3) - down 34%
Daventry - 157.1 (217.6) - down 28%
Three Rivers - 156.4 (259.3) - down 40%
Epping Forest - 154.9 (282.5) - down 45%
West Suffolk - 140.7 (204.4) - down 31%
Brentwood - 138.9 (194.8) - down 29%
South Norfolk - 136.3 (232.1) - down 41%
Uttlesford - 135.8 (208.1) - down 35%
Cambridge - 132.2 (181.9) - down 27%
East Suffolk - 130.3 (186.4) - down 30%
South Northamptonshire - 130.2 (207.4) - down 37%
North Norfolk - 120.2 (149.8) - down 20%
East Hertfordshire - 114.2 (223.7) - down 49%
Babergh - 101.0 (149.9) - down 33%
Mid Suffolk - 93.4 (162.7) - down 43%The Anglia region consists of the East of England counties of Bedfordshire, Cambridgeshire, Essex, Hertfordshire, Norfolk and Suffolk along with Northamptonshire, Rutland and the unitary authority area of Milton Keynes
Over-70s in England asked to contact NHS for vaccine appointment
Exclusive: Inside the secretive Porton Down lab as it tackles the Covid-19 pandemic
What do we know about the new coronavirus variants and will the vaccine work?
Is it safe to book a summer holiday for 2021? Will you get a refund if it is cancelled?