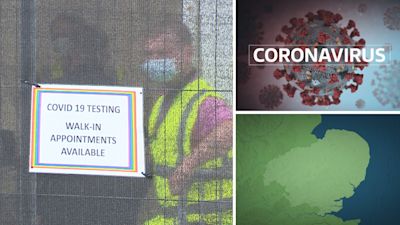
New coronavirus hotspots continue to emerge in the Anglia region

Great Yarmouth in Norfolk and Wellingborough in Northamptonshire are the latest areas in the Anglia region to raise concerns about rising numbers of new Covid-19 cases.
The Bedford area has also been added to the government's watchlist of local areas causing concern - Luton, Northampton and Peterborough are already on that list.
Northampton remains the town with the highest infection rate in the Eastern Counties with 72 new cases in the week to 3 August compared to 52 the week before.
Great Yarmouth saw 12 new positive tests in seven days to 4 August representing nearly half of all the cases in Norfolk that week. The week before Yarmouth recorded just one case. Health official say there has been an outbreak linked to a nursery in Gorleston.
In Wellingborough there were 23 new cases in the week to 3 August.
Norfolk County Council says it is working with Public Health England and Great Yarmouth Borough Council to help contain an outbreak linked to a nursery in Gorleston. It says everyone connected with the location has been contacted and given advice.
Louise Smith, Director of Public Health at Norfolk County Council, said: “We have seen an increase in the number of positive cases in Great Yarmouth area but these numbers are still small.
"At this stage all of the cases can be linked to known locations and there is no evidence of increased risk to the general public. We all need to work together to keep it that way.
Other areas of concern like Peterborough and Luton have fallen out of the list of the 20 places in England with the highest infection rates but there has only been a slight decline in the number of new positive tests in those towns.
The NHS has reported a further ten patients had died with coronavirus in the past week although no further deaths were reported on Friday.
Since the start of the pandemic, 6,021 people have died with coronavirus in hospitals, care homes and in the community in the area. The total figure includes people who have died without a positive test for Covid-19 but where the condition was declared on death certificates.
Here is the full list of local authorities in the Anglia region, showing the rate of new cases per 100,000 population in the seven days to 3 August, followed by the equivalent figure for the previous seven days to 27 July in brackets
Northampton 32.1 (22.3) - rising
Wellingborough 26.3 (1.3) - rising
Peterborough 19.3 (20.8) - falling
Luton 19.2 (19.7) - falling
Bedford 16.2 (19.6) - falling
East Northamptonshire 15.9 (6.3) - rising
Corby 9.7 (11.1) - falling
Great Yarmouth 8.1 (2.0) - rising
South Kesteven 7.0 (2.8) - rising
Daventry 7.0 (2.3) rising
Fenland 6.9 (7.9) - falling
Welwyn Hatfield 6.5 (0.0) - rising
Huntingdonshire 6.2 (6.2) - static
Harlow 5.7 (2.3) - rising
Stevenage 5.7 (4.6) - rising
Central Bedfordshire 5.5 (2.4) - rising
Chelmsford 5.0 (7.8) - falling
Kettering 4.9 (10.8) - falling
Tendring 4.8 (8.2) - falling
St Albans 4.7 (4.7) - static
Dacorum 4.5 (10.3) - falling
Aylesbury Vale 4.5 (2.5) - falling
Babergh 4.3 (4.3) - static
South Holland 4.2 (2.1) - rising
Cambridge 4.0 (8.0) - falling
Epping Forest 3.8 (4.6) - falling
Breckland 3.6 (2.9) - rising
Milton Keynes 3.3 (4.5)- falling
Castle Point 3.3 (6.6) - falling
King's Lynn and West Norfolk 3.3 (0.7) - rising
Uttlesford 3.3 (4.4) - falling
Braintree 3.3 (9.2) - falling
Harborough 3.2 (8.5) - falling
Chiltern 3.1 (3.1) - static
Broxbourne 3.1 (5.1) - falling
Hertsmere 2.9 (2.9) - static
South Cambridgeshire 2.5 (3.1) - falling
Broadland 2.3 (0.8) - rising
North Hertfordshire 2.2 (2.2) - static
Ipswich 2.2 (6.6) - falling
Basildon 2.1 (3.7) - falling
South Northamptonshire 2.1 (3.2) - falling
Colchester 2.1 (5.1) - falling
East Suffolk 2.0 (4.8) - falling
East Hertfordshire 2.0 (0.7) - rising
Maldon 1.5 (3.1) - falling
Brentwood 1.3 (2.6) - falling
Thurrock 1.1 (5.2) - falling
Rochford 1.1 (2.3) - falling
West Suffolk 1.1 (3.4) - falling
East Cambridgeshire 1.1 (0.0) - rising
North Norfolk 1.0 (1.0) - static
South Norfolk 0.7 (0.7) - static
Southend-on-Sea 0.5 (3.3) - falling
Rutland 0.0 (5.0) - falling
Norwich 0.0 (4.3) - falling
Mid Suffolk 0.0 (2.9) - falling
Find out more about how coronavirus has affected the Anglia region
How will schools return safely in September?
How will the Eat Out to Help Out scheme work and who is taking part
What are the new UK self-isolation rules and why has it increased to 10 days?
Check the number of cases in your area with our interactive map
Listen and subscribe to our podcast
All the coronavirus information you need in one place - from health and work to what you can do to stop the spread of the virus